
USD 29.96 billion Growth in Online Language Learning Market Size - Industry Analysis, Market Trends, Market Growth, Opportunities - Technavio
The analysts at Technavio have categorized the global online language learning market as a part of the global education services market. The report predicts the market to witness an accelerating growth momentum at a CAGR of 18.77%. 45% of the market's growth will originate from APAC during the forecast period with China and India emerging as the largest revenue-generating economies.
The emergence of Asia as the global hub for manufacturing and services will facilitate the online language learning market growth in APAC over the forecast period. In terms of the largest revenue-generating segment, the segment of the course held the largest online language learning market share during the projected period.
Online Language Learning Market Vendor Landscape
* The market is fragmented, and the degree of fragmentation will accelerate during the forecast period and vendors are deploying organic and inorganic growth strategies to compete in the market.
* Competitors have to focus on differentiating their product offerings with unique value propositions to strengthen their foothold in the market.
* Market vendors also have to leverage the existing growth prospects in the fast-growing segments, while maintaining their positions in the slow-growing segments.
* The key players in the market are adopting strategic developments to increase their market share across the globe.
Top Online Language Learning Market Players are:
* Babbel GmbH:
* Benesse Holdings Inc.
* Busuu Ltd.
* Cengage Learning Inc.
* Duolingo Inc.
* Educational Testing Service
* EF Education First Ltd.
* Enux Education Ltd.
* Houghton Mifflin Harcourt Co.
* inlingua International Ltd.
* IXL Learning Inc.
* Linguarama International Ltd.
* Linguatronics LC
* McGraw Hill Education Inc.
* New Oriental Education and Technology Group Inc.
* Oxford University Press
* Pearson Plc
* Sanako Oy
* Think and Learn Pvt. Ltd.
* Voxy Inc.
Online Language Learning Market Scope
Technavio presents a detailed picture of the market by the way of study, synthesis, and summation of data from multiple sources. The online language learning market report covers the following areas:
Online Language Learning Market FAQs
* Which is the latest market trend taking the market by the storm?
* What are some of the most influential market drivers, restraints, and opportunities (DROs)?
* What are the historical and projected revenue values and CAGR percentage?
* Which strategic initiatives will influence competitive scenarios and define the market growth potential?
* Which regions & segments will garner massive revenue and emerge as market leaders in upcoming years?
* Who are the top market share contributors and their latest organizational restructuring plans?
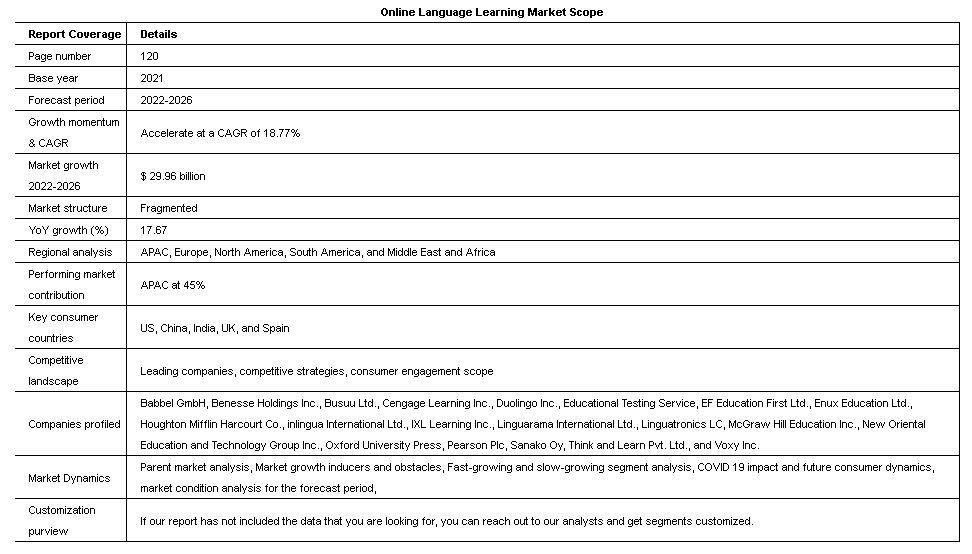
Table of Contents:
1 Executive Summary
1.1 Market overview
Exhibit 01: Executive Summary – Chart on Market Overview
Exhibit 02: Executive Summary – Data Table on Market Overview
Exhibit 03: Executive Summary – Chart on Global Market Characteristics
Exhibit 04: Executive Summary – Chart on Market by Geography
Exhibit 05: Executive Summary – Chart on Market Segmentation by Language
Exhibit 06: Executive Summary – Chart on Market Segmentation by Product
Exhibit 07: Executive Summary – Chart on Incremental Growth
Exhibit 08: Executive Summary – Data Table on Incremental Growth
Exhibit 09: Executive Summary – Chart on Vendor Market Positioning
2 Market Landscape
2.1 Market ecosystem
Exhibit 10: Parent market
Exhibit 11: Market Characteristics
3 Market Sizing
3.1 Market definition
Exhibit 12: Offerings of vendors included in the market definition
3.2 Market segment analysis
Exhibit 13: Market segments
3.3 Market size 2021
3.4 Market outlook: Forecast for 2021-2026
Exhibit 14: Chart on Global - Market size and forecast 2021-2026 ($ million)
Exhibit 15: Data Table on Global - Market size and forecast 2021-2026 ($ million)
Exhibit 16: Chart on Global Market: Year-over-year growth 2021-2026 (%)
Exhibit 17: Data Table on Global Market: Year-over-year growth 2021-2026 (%)
4 Five Forces Analysis
4.1 Five forces summary
Exhibit 18: Five forces analysis - Comparison between 2021 and 2026
4.2 Bargaining power of buyers
Exhibit 19: Chart on Bargaining power of buyers – Impact of key factors 2021 and 2026
4.3 Bargaining power of suppliers
Exhibit 20: Bargaining power of suppliers – Impact of key factors in 2021 and 2026
4.4 Threat of new entrants
Exhibit 21: Threat of new entrants – Impact of key factors in 2021 and 2026
4.5 Threat of substitutes
Exhibit 22: Threat of substitutes – Impact of key factors in 2021 and 2026
4.6 Threat of rivalry
Exhibit 23: Threat of rivalry – Impact of key factors in 2021 and 2026
4.7 Market condition
Exhibit 24: Chart on Market condition - Five forces 2021 and 2026
5 Market Segmentation by Language
5.1 Market segments
Exhibit 25: Chart on Language - Market share 2021-2026 (%)
Exhibit 26: Data Table on Language - Market share 2021-2026 (%)
5.2 Comparison by Language
Exhibit 27: Chart on Comparison by Language
Exhibit 28: Data Table on Comparison by Language
5.3 English - Market size and forecast 2021-2026
Exhibit 29: Chart on English - Market size and forecast 2021-2026 ($ million)
Exhibit 30: Data Table on English - Market size and forecast 2021-2026 ($ million)
Exhibit 31: Chart on English - Year-over-year growth 2021-2026 (%)
Exhibit 32: Data Table on English - Year-over-year growth 2021-2026 (%)
5.4 Mandarin - Market size and forecast 2021-2026
Exhibit 33: Chart on Mandarin - Market size and forecast 2021-2026 ($ million)
Exhibit 34: Data Table on Mandarin - Market size and forecast 2021-2026 ($ million)
Exhibit 35: Chart on Mandarin - Year-over-year growth 2021-2026 (%)
Exhibit 36: Data Table on Mandarin - Year-over-year growth 2021-2026 (%)
5.5 Spanish - Market size and forecast 2021-2026
Exhibit 37: Chart on Spanish - Market size and forecast 2021-2026 ($ million)
Exhibit 38: Data Table on Spanish - Market size and forecast 2021-2026 ($ million)
Exhibit 39: Chart on Spanish - Year-over-year growth 2021-2026 (%)
Exhibit 40: Data Table on Spanish - Year-over-year growth 2021-2026 (%)
5.6 Others - Market size and forecast 2021-2026
Exhibit 41: Chart on Others - Market size and forecast 2021-2026 ($ million)
Exhibit 42: Data Table on Others - Market size and forecast 2021-2026 ($ million)
Exhibit 43: Chart on Others - Year-over-year growth 2021-2026 (%)
Exhibit 44: Data Table on Others - Year-over-year growth 2021-2026 (%)
5.7 Market opportunity by Language
Exhibit 45: Market opportunity by Language ($ million)
6 Market Segmentation by Product
6.1 Market segments
Exhibit 46: Chart on Product - Market share 2021-2026 (%)
Exhibit 47: Data Table on Product - Market share 2021-2026 (%)
6.2 Comparison by Product
Exhibit 48: Chart on Comparison by Product
Exhibit 49: Data Table on Comparison by Product
6.3 Courses - Market size and forecast 2021-2026
Exhibit 50: Chart on Courses - Market size and forecast 2021-2026 ($ million)
Exhibit 51: Data Table on Courses - Market size and forecast 2021-2026 ($ million)
Exhibit 52: Chart on Courses - Year-over-year growth 2021-2026 (%)
Exhibit 53: Data Table on Courses - Year-over-year growth 2021-2026 (%)
6.4 Solutions - Market size and forecast 2021-2026
Exhibit 54: Chart on Solutions - Market size and forecast 2021-2026 ($ million)
Exhibit 55: Data Table on Solutions - Market size and forecast 2021-2026 ($ million)
Exhibit 56: Chart on Solutions - Year-over-year growth 2021-2026 (%)
Exhibit 57: Data Table on Solutions - Year-over-year growth 2021-2026 (%)
6.5 Apps - Market size and forecast 2021-2026
Exhibit 58: Chart on Apps - Market size and forecast 2021-2026 ($ million)
Exhibit 59: Data Table on Apps - Market size and forecast 2021-2026 ($ million)
Exhibit 60: Chart on Apps - Year-over-year growth 2021-2026 (%)
Exhibit 61: Data Table on Apps - Year-over-year growth 2021-2026 (%)
6.6 Market opportunity by Product
Exhibit 62: Market opportunity by Product ($ million)
7 Customer Landscape
7.1 Customer landscape overview
Exhibit 63: Analysis of price sensitivity, lifecycle, customer purchase basket, adoption rates, and purchase criteria
8 Geographic Landscape
8.1 Geographic segmentation
Exhibit 64: Chart on Market share by geography 2021-2026 (%)
Exhibit 65: Data Table on Market share by geography 2021-2026 (%)
8.2 Geographic comparison
Exhibit 66: Chart on Geographic comparison
Exhibit 67: Data Table on Geographic comparison
8.3 APAC - Market size and forecast 2021-2026
Exhibit 68: Chart on APAC - Market size and forecast 2021-2026 ($ million)
Exhibit 69: Data Table on APAC - Market size and forecast 2021-2026 ($ million)
Exhibit 70: Chart on APAC - Year-over-year growth 2021-2026 (%)
Exhibit 71: Data Table on APAC - Year-over-year growth 2021-2026 (%)
8.4 Europe - Market size and forecast 2021-2026
Exhibit 72: Chart on Europe - Market size and forecast 2021-2026 ($ million)
Exhibit 73: Data Table on Europe - Market size and forecast 2021-2026 ($ million)
Exhibit 74: Chart on Europe - Year-over-year growth 2021-2026 (%)
Exhibit 75: Data Table on Europe - Year-over-year growth 2021-2026 (%)
8.5 North America - Market size and forecast 2021-2026
Exhibit 76: Chart on North America - Market size and forecast 2021-2026 ($ million)
Exhibit 77: Data Table on North America - Market size and forecast 2021-2026 ($ million)
Exhibit 78: Chart on North America - Year-over-year growth 2021-2026 (%)
Exhibit 79: Data Table on North America - Year-over-year growth 2021-2026 (%)
8.6 South America - Market size and forecast 2021-2026
Exhibit 80: Chart on South America - Market size and forecast 2021-2026 ($ million)
Exhibit 81: Data Table on South America - Market size and forecast 2021-2026 ($ million)
Exhibit 82: Chart on South America - Year-over-year growth 2021-2026 (%)
Exhibit 83: Data Table on South America - Year-over-year growth 2021-2026 (%)
8.7 Middle East and Africa - Market size and forecast 2021-2026
Exhibit 84: Chart on Middle East and Africa - Market size and forecast 2021-2026 ($ million)
Exhibit 85: Data Table on Middle East and Africa - Market size and forecast 2021-2026 ($ million)
Exhibit 86: Chart on Middle East and Africa - Year-over-year growth 2021-2026 (%)
Exhibit 87: Data Table on Middle East and Africa - Year-over-year growth 2021-2026 (%)
8.8 China - Market size and forecast 2021-2026
Exhibit 88: Chart on China - Market size and forecast 2021-2026 ($ million)
Exhibit 89: Data Table on China - Market size and forecast 2021-2026 ($ million)
Exhibit 90: Chart on China - Year-over-year growth 2021-2026 (%)
Exhibit 91: Data Table on China - Year-over-year growth 2021-2026 (%)
8.9 US - Market size and forecast 2021-2026
Exhibit 92: Chart on US - Market size and forecast 2021-2026 ($ million)
Exhibit 93: Data Table on US - Market size and forecast 2021-2026 ($ million)
Exhibit 94: Chart on US - Year-over-year growth 2021-2026 (%)
Exhibit 95: Data Table on US - Year-over-year growth 2021-2026 (%)
8.10 India - Market size and forecast 2021-2026
Exhibit 96: Chart on India - Market size and forecast 2021-2026 ($ million)
Exhibit 97: Data Table on India - Market size and forecast 2021-2026 ($ million)
Exhibit 98: Chart on India - Year-over-year growth 2021-2026 (%)
Exhibit 99: Data Table on India - Year-over-year growth 2021-2026 (%)
8.11 UK - Market size and forecast 2021-2026
Exhibit 100: Chart on UK - Market size and forecast 2021-2026 ($ million)
Exhibit 101: Data Table on UK - Market size and forecast 2021-2026 ($ million)
Exhibit 102: Chart on UK - Year-over-year growth 2021-2026 (%)
Exhibit 103: Data Table on UK - Year-over-year growth 2021-2026 (%)
8.12 Spain - Market size and forecast 2021-2026
Exhibit 104: Chart on Spain - Market size and forecast 2021-2026 ($ million)
Exhibit 105: Data Table on Spain - Market size and forecast 2021-2026 ($ million)
Exhibit 106: Chart on Spain - Year-over-year growth 2021-2026 (%)
Exhibit 107: Data Table on Spain - Year-over-year growth 2021-2026 (%)
8.13 Market opportunity by geography
Exhibit 108: Market opportunity by geography ($ million)
9 Drivers, Challenges, and Trends
9.1 Market drivers
9.2 Market challenges
9.3 Impact of drivers and challenges
Exhibit 109: Impact of drivers and challenges in 2021 and 2026
9.4 Market trends
10 Vendor Landscape
10.1 Overview
10.2 Vendor landscape
Exhibit 110: Overview on Criticality of inputs and Factors of differentiation
10.3 Landscape disruption
Exhibit 111: Overview on factors of disruption
10.4 Industry risks
Exhibit 112: Impact of key risks on business
11 Vendor Analysis
11.1 Vendors covered
Exhibit 113: Vendors covered
11.2 Market positioning of vendors
Exhibit 114: Matrix on vendor position and classification
11.3 Cengage Learning Inc.
Exhibit 115: Cengage Learning Inc. - Overview
Exhibit 116: Cengage Learning Inc. - Product / Service
Exhibit 117: Cengage Learning Inc. - Key offerings
11.4 Duolingo Inc.
Exhibit 118: Duolingo Inc. - Overview
Exhibit 119: Duolingo Inc. - Product / Service
Exhibit 120: Duolingo Inc. - Key offerings
11.5 EF Education First Ltd.
Exhibit 121: EF Education First Ltd. - Overview
Exhibit 122: EF Education First Ltd. - Product / Service
Exhibit 123: EF Education First Ltd. - Key offerings
11.6 Houghton Mifflin Harcourt Co.
Exhibit 124: Houghton Mifflin Harcourt Co. - Overview
Exhibit 125: Houghton Mifflin Harcourt Co. - Business segments
Exhibit 126: Houghton Mifflin Harcourt Co. - Key offerings
Exhibit 127: Houghton Mifflin Harcourt Co. - Segment focus
11.7 IXL Learning Inc.
Exhibit 128: IXL Learning Inc. - Overview
Exhibit 129: IXL Learning Inc. - Product / Service
Exhibit 130: IXL Learning Inc. - Key offerings
11.8 McGraw Hill Education Inc.
Exhibit 131: McGraw Hill Education Inc. - Overview
Exhibit 132: McGraw Hill Education Inc. - Business segments
Exhibit 133: McGraw Hill Education Inc. - Key offerings
Exhibit 134: McGraw Hill Education Inc. - Segment focus
11.9 New Oriental Education and Technology Group Inc.
Exhibit 135: New Oriental Education and Technology Group Inc. - Overview
Exhibit 136: New Oriental Education and Technology Group Inc. - Business segments
Exhibit 137: New Oriental Education and Technology Group Inc. - Key offerings
Exhibit 138: New Oriental Education and Technology Group Inc. - Segment focus
11.10 Pearson Plc
Exhibit 139: Pearson Plc - Overview
Exhibit 140: Pearson Plc - Business segments
Exhibit 141: Pearson Plc - Key offerings
Exhibit 142: Pearson Plc - Segment focus
11.11 Sanako Oy
Exhibit 143: Sanako Oy - Overview
Exhibit 144: Sanako Oy - Product / Service
Exhibit 145: Sanako Oy - Key offerings
11.12 Voxy Inc.
Exhibit 146: Voxy Inc. - Overview
Exhibit 147: Voxy Inc. - Product / Service
Exhibit 148: Voxy Inc. - Key offerings
12 Appendix
12.1 Scope of the report
12.2 Inclusions and exclusions checklist
Exhibit 149: Inclusions checklist
Exhibit 150: Exclusions checklist
12.3 Currency conversion rates for US$
Exhibit 151: Currency conversion rates for US$
12.4 Research methodology
Exhibit 152: Research methodology
Exhibit 153: Validation techniques employed for market sizing
Exhibit 154: Information sources
12.5 List of abbreviations
Exhibit 155: List of abbreviations
About Us
Technavio is a leading global technology research and advisory company. Their research and analysis focus on emerging market trends and provides actionable insights to help businesses identify market opportunities and develop effective strategies to optimize their market positions. With over 500 specialized analysts, Technavio's report library consists of more than 17,000 reports and counting, covering 800 technologies, spanning across 50 countries. Their client base consists of enterprises of all sizes, including more than 100 Fortune 500 companies. This growing client base relies on Technavio's comprehensive coverage, extensive research, and actionable market insights to identify opportunities in existing and potential markets and assess their competitive positions within changing market scenarios.


